Knowledgebase: Website Monitoring

How to View Website Monitoring Performance Data

Posted by on October 07 2015 01:28 PM

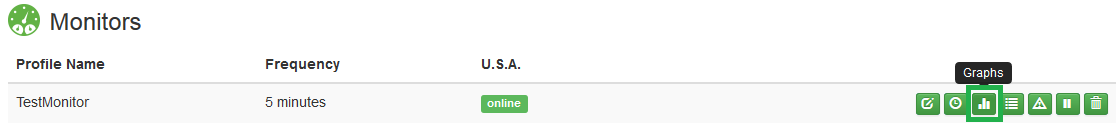
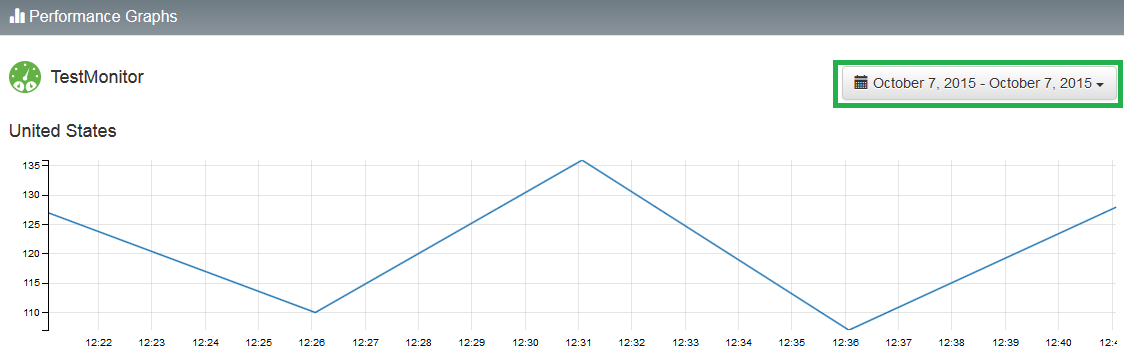
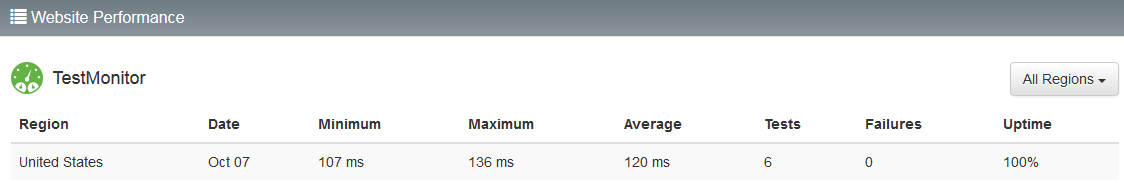
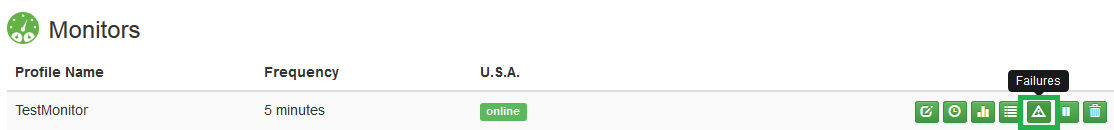
Website Monitoring by SiteBackup will monitor your site for response time and uptime. The monitoring service will automatically generate performance graphs to show the response time of your website for each check that is done. For information on how to enable website monitoring, please see this article: How to Enable Website Monitoring

  • From the SiteBackup dashboard, click the Performance Graphs button to the right of the Website Monitor you wish to review.


  • You will be taken to a graph that shows the response time of your website. To change the date range, simply click on the top right drop down menu and enter new dates, then click Apply.

  • You can also review a summary of the performance data by clicking the Performance button to the right of the Website Monitor, from the SiteBackup dashboard.

  • Your performance data will be displayed in a summary for you to review.


  • To view a list of failures only, click the Failures button to the right of the website monitor, from the SiteBackup dashboard.

If you have any further questions that were not answered in this article, please contact us.

(0 vote(s))
This article was helpful
This article was not helpful

Comments (0)
Copyright © 2016 HostMySite